Recently I received an excel file with the coordinates of 144 vegetation sample plots, with the request to get the altitude values for the plots. For those with little experience in GIS, this is easy enough in most GIS programs. Here is a simple tutorial/example how to extract raster values at point locations in QGIS.
Using plugins in QGIS
QGIS is a free and easy to use GIS program. Out-of-the-box it has limited tools for spatial analyses and data handling. But its capacities are expanding with each new version. Furthermore, there are a lot of plugins available that further extend its data handling and analyses options. Some come pre-installed, others can be easily downloaded and installed through the Plugin installer. Below I am using three plugins, the Add delimited text layer, the Point Sampling Tool and the Create zips from layers. You can find both under Plugins menu or in the Plugin toolbar (enable this toolbar under the View menu if needed).
Update: see this post for an alternative approach, which will be more convenient if you want to retain all columns in the attribute table of your original point layer.
If you can’t find the plugins, check under the Plugins menu | Manage plugins if these plugins are enabled. If they aren’t there either, you’ll have to download and install them. This is very easy; open the menu Plugins | Fetch Python Plugins. There is an official QGIS repository from where you can download plugins. Many more are available from third party repositories, which you can enable under the tab ‘Repositories’. Under the Plugins tab, you can select the plugins you want to install. Unfortunately the description is often very succinct, so it is not always clear what the plugins are for. But you can always install them to try them out or otherwise Google is your friend. After selecting the plugins you want, just click ‘install plugin‘.
I am assuming here that you are using the latest version of QGIS (as of this writing version 1.4.0). In older versions the vector tools (under Menu: Vector) are not included yet. If for whatever reason you don’t want or can’t install the latest version, you can get the vector tools as the separate plugin Ftools.
Creating a layer from a delimited text file
(1) You’ll need to export the spreadsheet to a text file (csv or tab delimited) first. You can then import the text file with coordinates as a point file in QGIS.
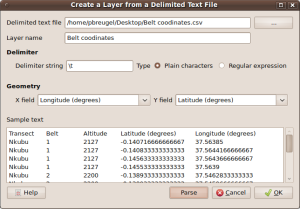
Menu: Plugins –> Delimited text –> Add delimited text layer
(2) Fill in the fields, e.g., see screenshot where I am importing a tab delimited text file.
(3) To spell out the obvious: check for errors. These are often easy to spot as outliers
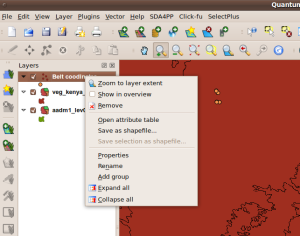
(4) Save the file; right click with the mouse right on the just created layer in the Layers panel and select Save as shapefile...
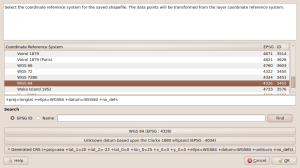
(5) After filling in the Save as screen you will be asked to select the coordinate system. Make sure to fill in the same coordinate system as used on your GPS while recording the data. In this case the coordinate system was WGS 84 (EPSG 4326).
Sample one or more rasters at point locations
(7) Now open the newly created shapefile and the raster layer from which you want to extract the values at the location of the points. In this example we open the SRTM 90m Digital Elevation Model (DEM), which I downloaded from CSI-CGIAR. This data is available in 5 deg x 5 degrees tiles in the geographic coordinate system WGS84 datum.
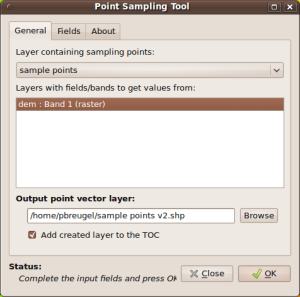
(8) Now you can use the plugin ‘Point sampling tool’ to extract raster values at the location of the points in the point file.
Menu: Plugins | Analyses | Point sampling tool
after which you will see the following screen in which you need to select the raster layer(s) from which to extract the values and the point layer.
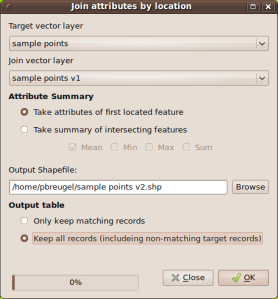
(9) Now, the new point file only contains the values extracted from the raster layer, none of the fields in the original point layer is copied to the new one. This is rather unfortunate, but luckily it is easy enough to join the values of the two vector layers using a spatial join:
Menu: Vector | Data management tool | Join attributes by location
(10) Now, you’ll have your shapefile with the original columns as well as a column with the altitude for each point. Because I have to send the resulting shapefile by email, I am using the Create zips from layers plugin to zip the shapefile. Look under the Plugin menu for this plugin.
Note that in QGIS you can also extract raster values at point locations using the GRASS GIS plugin. Alternatively, do this in GRASS GIS directly. This probably works better with very large data sets and of course if you want to store the vector map in a GRASS GIS database for later analyses. See here how.

I am new to QGIS and slightly confused, if I want to sample raster points within a vector shape how do I go about this?
Do you have any ideas on how to re-join the attribute information when many records in your point data have exactly the same lat and lon (and therefore you can’t do a spatial join)?
Many thanks,
Arianna
I don’t think that is possible, or not in an easy way in any case. However, since I wrote this post, QGIS got access to many more functions via the processing toolbox. One of those functions is the Saga function ‘Add grid values to point’, which is probably what you are looking for.
Note that for this function to be available, you must have installed Saga GIS and than enable it in the processing options. You can do this by going to: menu: processing – options and configuration – providers – SAGA and than select the Activate box. In Windows you may have to give the path to the SAGA executable (not sure as I am not running this on Windows).
After that, open the processing toolbox (go to menu: view – panels – toolbox) and look for the function ‘Add grid values to points’ in: SAGA – Shapes – Grid (easiest way to find that function is to start typing the name of the function in the search box).
Thank you very much. It worked perfectly.
Pingback: Sampling raster values at point locations in QGIS – an update | Ecostudies
Hello there, You’ve done an excellent job. I will definitely digg it and personally recommend to my friends.
I am confident they will be benefited from this site.