
After four months of development the new update release GRASS GIS 7.2.1 is available. It provides more than 150 stability fixes and manual improvements compared to the first stable release version 7.2.0. An overview of new features in this release series is available at New Features in GRASS GIS 7.2. See here the original announcement on the GRASS GIS website.
Plotting GRASS data in Python
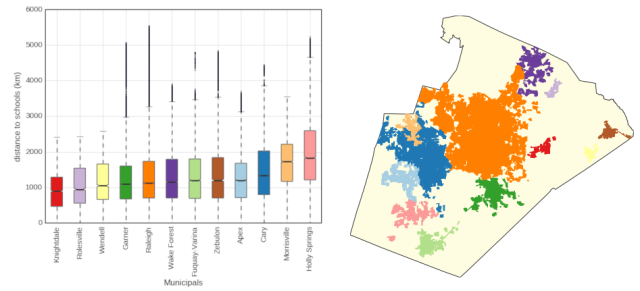
GRASS GIS offers some useful but basic plotting options for raster data. However, for plotting of data in attribute tables and for more advanced graphs, we need to use other software tools. In this tutorial I explore some of the possibilities offered by Pandas plot() and how we can further tune plots using matplotlib / pyplot library.
GRASS and Pandas – from attribute table to pandas dataframe
Introduction
In this post I show how to import an attribute table of a vector layer in a GRASS GIS database into a Pandas data frame. Pandas stands for Python Data Analysis Library which provides high-performance, easy-to-use data structures and data analysis tools for the Python programming language. For people familiar with R, the Pandas data frame is an object similar to the R data frame. They are a lot like the most common way in which spreadsheets are used, with the data presented in rectangular form with columns holding variables and rows holding observations. An important characteristic is that the data frame, like a spreadsheet, can hold different types of data in different columns: numbers, character data, dates and so on. Continue reading “GRASS and Pandas – from attribute table to pandas dataframe”
Update r.vif add-on for GRASS GIS
I just updated the r.vif add-on. The add-on let’s you do a step-wise variance inflation factor (VIF) procedure. As explained in more detail here, the VIF can be used to detect multicollinearity in a set of explanatory variables. The step-wise selection procedure provides a way to select a et of variables with sufficient low multicollinearity.
The update should make the computation of VIF much faster. For very large raster layers it is possible to have the VIF computed based on a random subset of raster cells. There is also a low-memory option. This allows one to run this add-on with much larger data sets. But, as explained in the r.vif manual page, it also runs considerably slower.
Exporting rasters to Mbtiles using GDAL
Web maps are generally made up of many small, square images called tiles, which are placed side by side in order to create the illusion of a very large seamless image [for a good explanation, see here].
Tiled based maps can be made up of many tiles. Loading all those tiles would be inefficient and slow. That is where the MBtiles, developed by Mapbox, come in. The MBtiles specification is an efficient format for storing millions of tiles in a single SQLite database.
I have written before about Tilemill, a great tool to create great looking interactive maps. Since then more tools have come available to create MBtiles. Continue reading “Exporting rasters to Mbtiles using GDAL”
Terrain attribute selection in environmental studies
Exploring species-environment relationships is important for amongst others habitat mapping, biogeographical classification, conservation, and management. And it has become easier with (i) the advance of a wide range of tools, including many open source tools, and (ii) availability of more relevant data sources. For example, there are many tools with which it is relatively easy to create a wide range of derived terrain variables using digital elevation (DEM) or bathymetric (DBM) models. However, the ease of use of many of these tools, especially when used by non-experts, may lead to the selection of arbitrary or sub-optimal set of variables. In addition, derived variables will often be highly correlated (Lecours et al. 2017).
Continue reading “Terrain attribute selection in environmental studies”
New release RQGIS
From an announcement from the QGIS mailing list: RQGIS has released a new version of RQGIS! RQGIS establishes an interface between R and QGIS, i.e. it allows the user to access the QGIS geoalgorithms from within R. With the new release, it is possible to run the most recent QGIS releases (>=2.18.2) with RQGIS.
Saving space on your HD – null file compression in GRASS GIS 7.2
The GRASS GIS development team recently released a new stable major release, GRASS GIS 7.2. The release brings more than 1900 fixes and improvements since the previous stable release 7.0.5. You’ll find a detailed overview of all the changes and improvements on this GRASS wiki page.
One important library change in a GRASS library is support for NULL file compression using the r.null function. This may not sound terribly exciting to all of you, but for those that have GRASS databases with large (number of) raster layers, this may save considerable space on the hard disk.
Continue reading “Saving space on your HD – null file compression in GRASS GIS 7.2”
The first release candidate of GRASS GIS 7.2.0 is out
I have been using the development version for some time now, and all I can say is that you definitely should give the new GRASS GIS 7.2.0RC1 release a try. It is, in my experience, very stable, and it provides more than 1900 stability fixes and manual improvements compared to the stable releases 7.0.x.
It also features a number of new modules. A favourite of mine is the new g.gui.datacatalog which makes it so much easier to browse, modify and manage GRASS maps across map sets and locations. Also very welcome is the new d.legend.vect module which can be used to display a vector legend in the active graphics frame. And for those that are into space-time analyses, there are also a number of new modules for the temporal framework.
For more information about all the improvements and changes, see the detailed announcement. And while you are at it, don’t forget to check out the add-ons, some great new ones have been added and updated in the last few months.
And last but not least, a big thanks to the developers!
A GRASS GIS addon to upload raster values and labels to a point layer
In GRASS GIS you can upload raster values at positions of vector points to the attribute table of that vector point layer using the function v.what.rast. If you also interested in the raster category labels, you can have a look at r.what, which lets you query a raster map on their category values and category labels.
However, the results of r.what are written to a text file. If you want to upload raster values and labels to the attribute table of a point vector map, you can use v.in.ascii to import the text file created with r.what as a point vector layer in GRASS GIS.
Fairly straightforward, but wouldn’t it be even more convenient if you you had an option in r.what.rast to also upload the category labels? Continue reading “A GRASS GIS addon to upload raster values and labels to a point layer”
